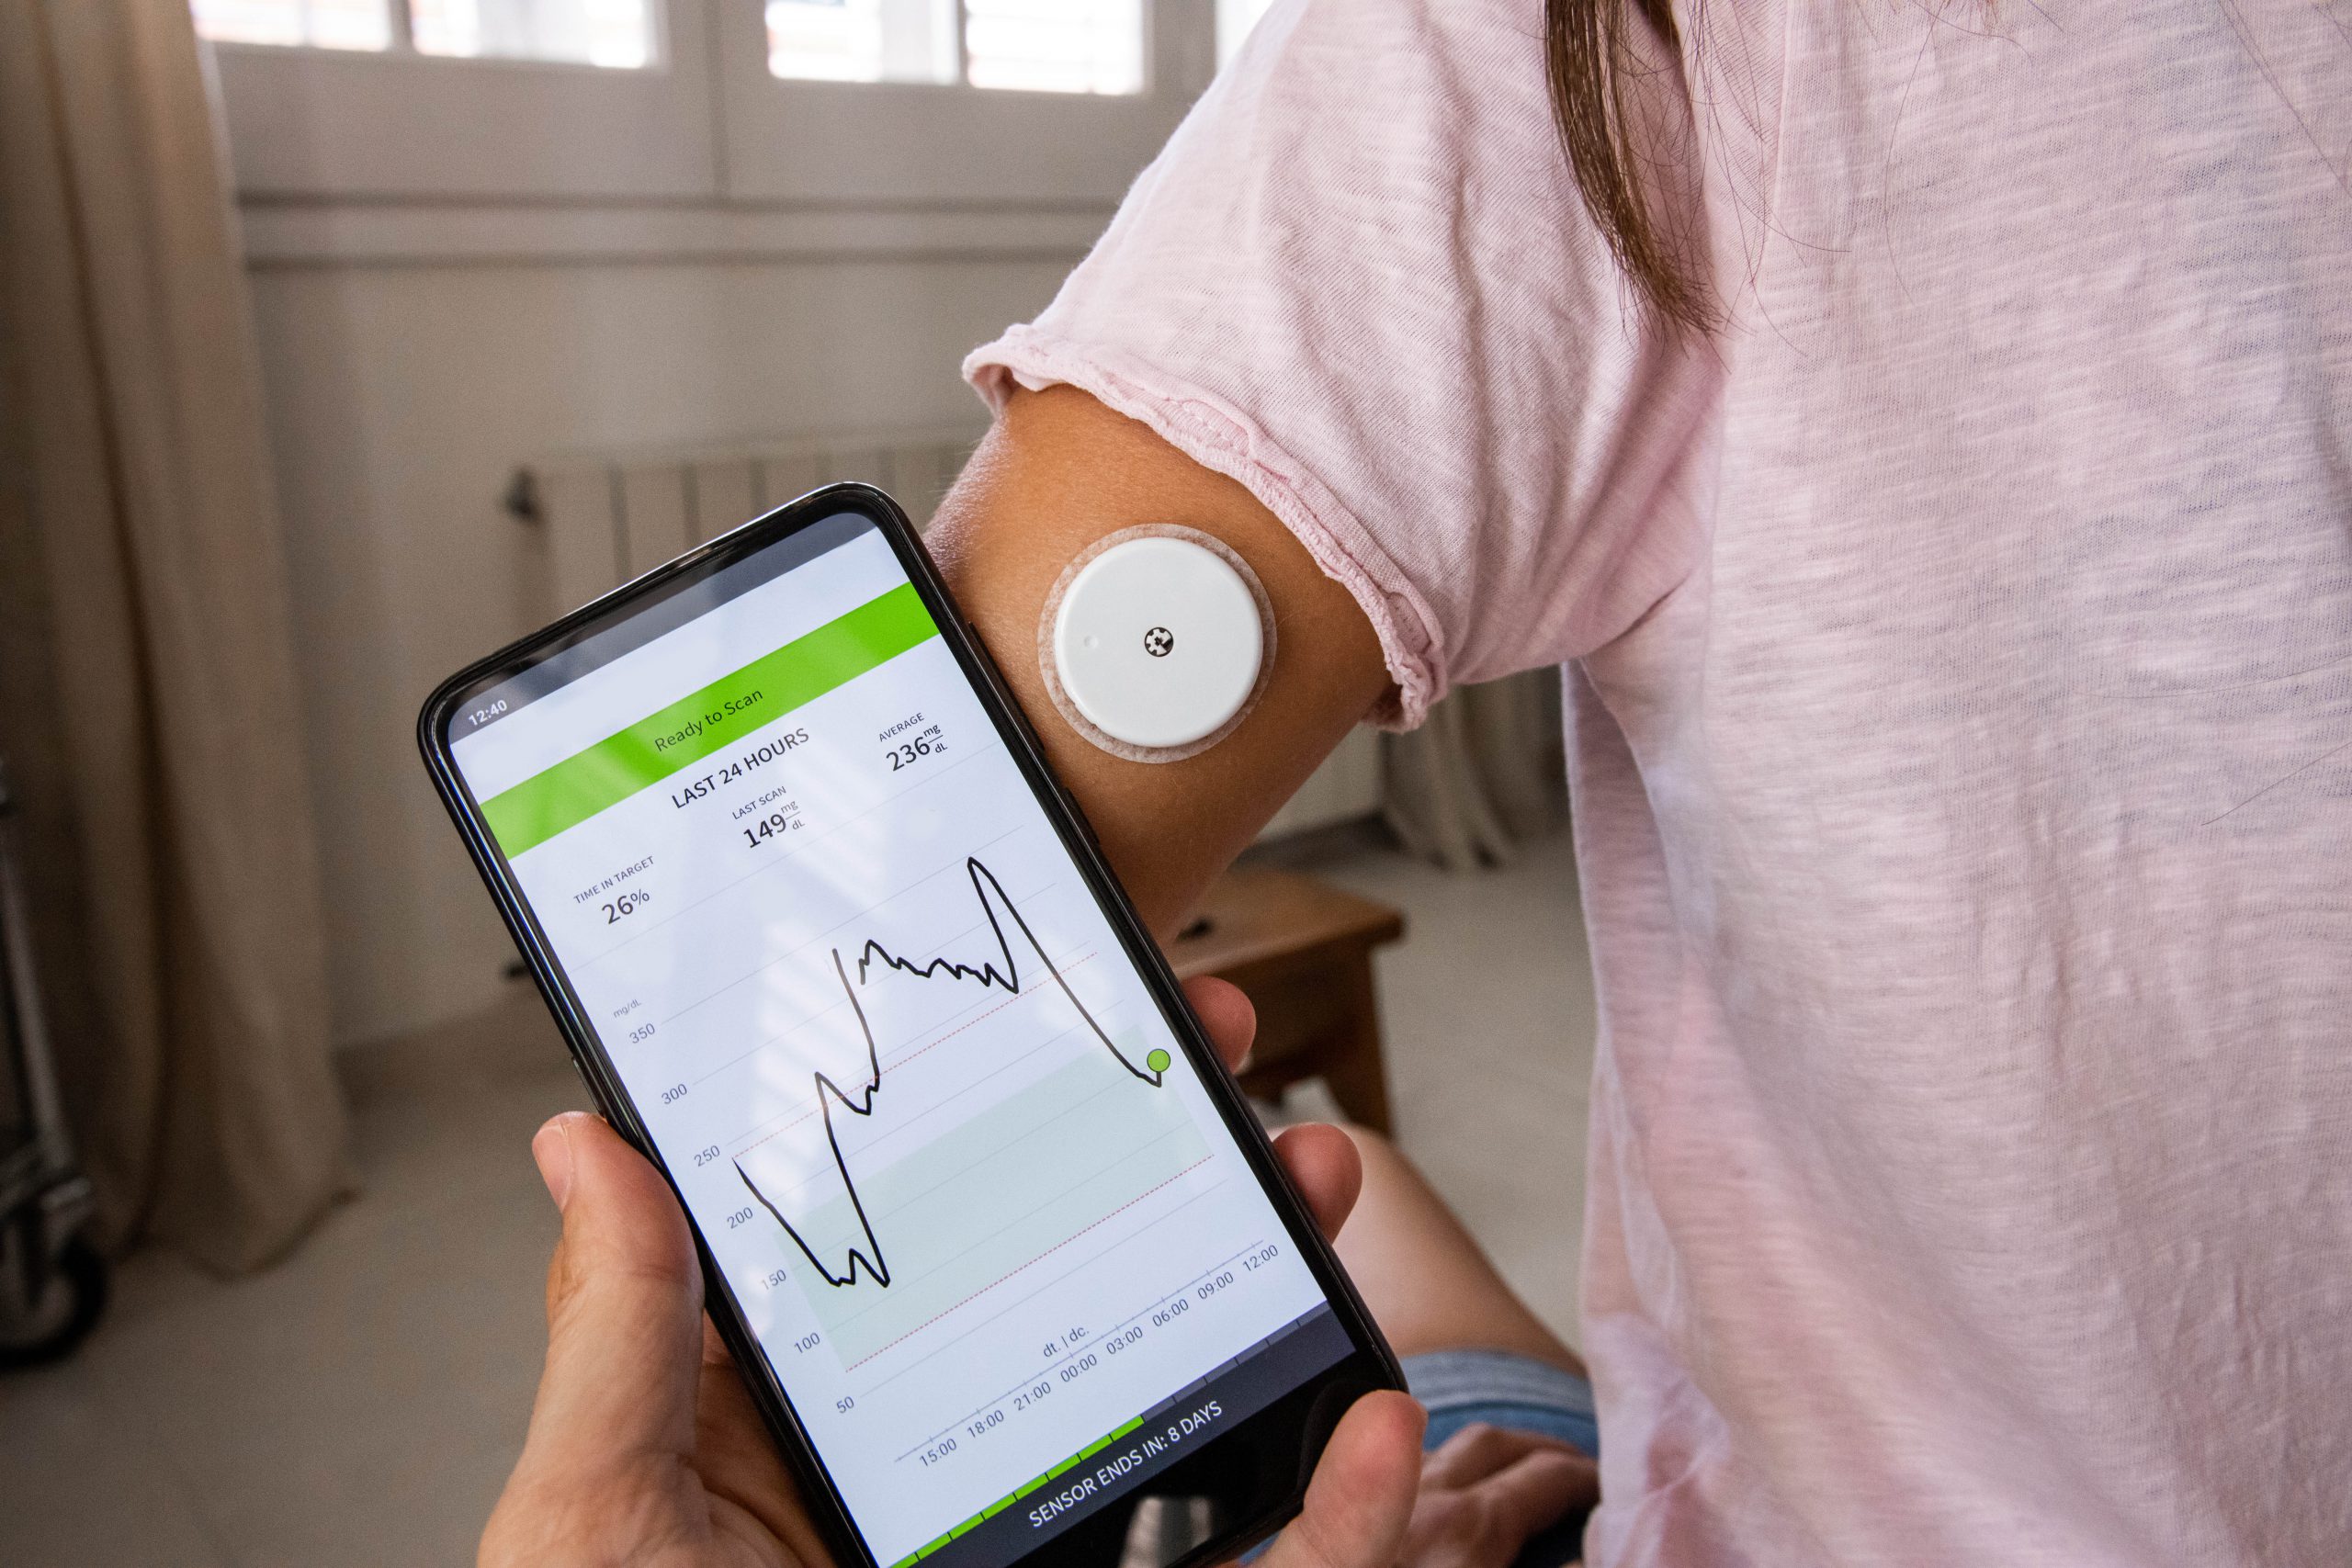
Ask any of the nearly one in 10 Americans diagnosed with diabetes and they’ll say keeping their blood sugar controlled throughout the day is essential. Yet, it is often an elusive goal. That’s because even subtle changes in diet, activity or stress can cause glucose levels to fluctuate drastically.
To manage their condition, many people with diabetes test their blood sugar frequently. A relatively new class of wearable devices, called continuous glucose monitors (CGMs), are making the job easier. A sensor under the skin can give blood sugar readings every few minutes and record every data point (~ 288 per day) over a two-week period. While CGM proponents say this wealth of data can help by showing personal patterns of blood sugar fluctuation, others admit they’re overwhelmed by the detail. A new risk score might be the key to simplifying CGM data so more patients and physicians can use it in meaningful ways.
“Patients need to calibrate insulin injections throughout the day and physicians need to adjust a patient’s medication regimen throughout the year – these decisions rely on data,” said Dr. David Klonoff, director of the Diabetes Research Institute at Sutter’s Mills-Peninsula Medical Center in San Mateo, Calif. “So the tendency is to think that having more data is better, but in reality too much data can be difficult to interpret and act on.”
The standard CGM data report includes seven separate measures – more than most primary care physicians can process in a short office visit. “The other problem is that a patient might be within a target range for some measures and slightly or significantly out of range for other measures, and looking at these seven measurements, it can be difficult to get an overall sense for exactly how well a patient is actually doing.”
Various single measures of glucose control have been proposed as alternatives, but each has a flaw that limits their usefulness. For example, the A1c score, a measure of average blood sugar over three months, doesn’t reflect the wide fluctuations in blood sugar levels that CGM data often shows. Composite scores, which can account for irregular readings, have generally been criticized for minimizing the importance of hypoglycemic episodes (when blood sugar is lower than normal) or extreme episodes (periods of very high or very low blood sugar).
To look at the problem in a new way, Dr. Klonoff invited 330 diabetes experts to review two weeks of CGM data from 225 different people who were using insulin and wearing a continuous glucose monitor. The experts were each asked to rank 15 ‘patient profiles’ from best to worst in terms of how well controlled the individual’s blood sugar appeared to be.
Then Dr. Klonoff worked with a team of statisticians to create a mathematical formula that could reliably reproduce the expert ranking for each patient profile. “Effectively we built an algorithm that does what experts do; take in a bunch of raw data, assign different weights (or relative importance) to some pieces of that data, analyze all of it together as a holistic picture, and devise a single risk score – what we’re now calling the Glycemia Risk Index.”
Dr. Klonoff owes much of the development of the Glycemia Risk Index to the work of statisticians who ran complex computer models, aided by machine learning, to develop and test the final formula: GRI = (3.0 × Very Low) + (2.4 × Low) + (1.6 × Very High) + (0.8 × High). He thanks the following individuals for their unique applied mathematic contributions:
• Michael A. Kohn, MD, MPP (University of California, San Francisco)
• Boris Kovatchev, PhD (University of Virginia)
• David Rodbard, MD (Biomedical Informatics Consultants)
• Chengdong Li, PhD (Florida State University)
• Dorian Liepmann, PhD (University of California, Berkeley)
Importantly, Dr. Klonoff found that only four variables – percent of time when the patient had low, very low, high, or very high blood sugar – were clinically actionable. The composite Glycemia Risk Index accounts for these variables similar to how a Yelp score accounts for a variety of features of a restaurant from the food to the parking, table service, cleanliness, noise, etc.
Next Steps
Dr. Klonoff cautions that the novel Glycemia Risk Index still needs to be validated in studies designed to determine how well it predicts patient outcomes. He further warns that the GRI is not a substitute for looking at an individual’s other glycemic metrics, but rather offers a summary risk score.
“If the GRI score is good, then the patient can continue with their current diabetes care plan, but if the score is bad (indicating large or frequent abnormal blood sugar levels), then the patient’s clinician can either adjust treatment or refer the patient to a diabetes specialist.”
For clinicians, statisticians and other researchers the GRI has other benefits too; it could inform automated insulin dosing systems or predictive models, both aimed at reducing complications and improving outcomes for diabetics. Finally, the GRI can be applied to an entire population of patients who are receiving a new treatment, so a clinician can see if overall glucose control is better with the new treatment.


